

Update to the Blog Post – Learn Power BI and Build Your Own Coronavirus Report
Dataset Updated
The Johns Hopkins University Center for Systems Science and Engineering (JHU CSSE), supported by ESRI Living Atlas Team and the Johns Hopkins University Applied Physics Lab (JHU APL), has updated the dataset files and they have a new names and the US data has new files that break down by state. The US as a whole is still in the global datasets.
The good news is you can follow the original blog post but just use the new files for the global data and/or the US data.
JHU CSSE GitHub Repo/Folder with COVID-19 Data in Time Series Format – https://github.com/CSSEGISandData/COVID-19/tree/master/csse_covid_19_data/csse_covid_19_time_series
In the GitHub folder you will find three CSV (Comma Separated Values) files (see image below); one for Confirmed Cases, one for Recovered Cases and one for Deaths for Global and new files for US.
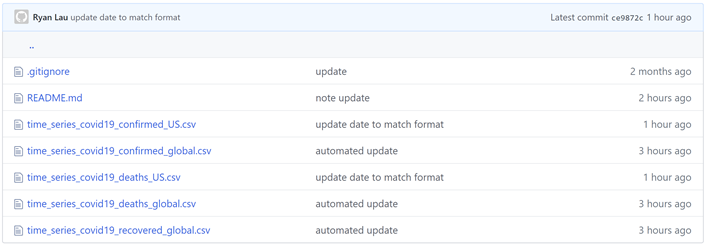
URLs for the 3 Updated files for Global Dataset:
Confirmed Cases – https://raw.githubusercontent.com/CSSEGISandData/COVID-19/master/csse_covid_19_data/csse_covid_19_time_series/time_series_covid19_confirmed_global.csv
Recovered Cases – https://raw.githubusercontent.com/CSSEGISandData/COVID-19/master/csse_covid_19_data/csse_covid_19_time_series/time_series_covid19_recovered_global.csv
Deaths – https://github.com/CSSEGISandData/COVID-19/blob/master/csse_covid_19_data/csse_covid_19_time_series/time_series_covid19_deaths_global.csv
Dates for Non-US Users
The dates in the file are stored in US format. For users outside of the US please follow Jeff Meddemmen comment from my original post:
“For countries who use a different date format that the source data (i.e in UK we use DD-MM-YYYY) during the Power Query steps when we are changing the Change Type of the columns if you change it just to ‘Date’ as directed then it results in errors. You need to first select Change Type > Locale and then select ‘Date’ and ‘English (United States)’. Then do this again to convert to another format. i.e. again select Change Type > Locale, select ‘Date’ and ‘English (United Kingdom)’ when it prompts if you want to replace the existing Change or add a new Step, choose to Add a new step. You need to repeat that for all the tables.”
New Power BI File with more DAX including Doubling Times!
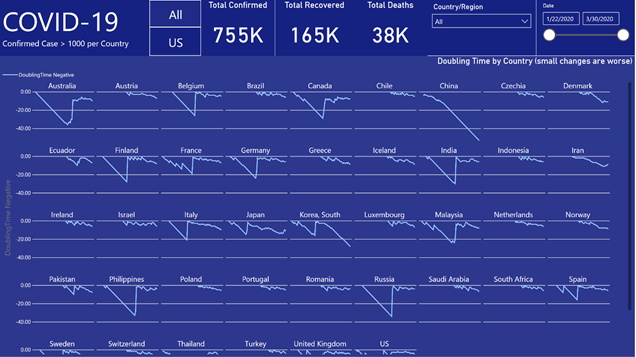
I have a more detailed Power BI file (it produced the image above) with DAX for normalizing the dates to first confirmed case by Country and normalizing dates by date first 100 cases.S
You can find the detailed Power BI file in my GitHub here:
https://github.com/STATCowboy/Power-BI-Coronavirus-Report-Tutorial/blob/master/Covid-19%20via%20Power%20BI.pbix.
Thanks
I hoped you enjoyed learning how to user Power BI and how to build your own report for the Novel Coronavirus (COVID-19). If you want to learn more about Power BI check out the official Power BI documentation – https://docs.microsoft.com/en-us/power-bi/. Also, follow Adam and Patrick on the Guy in a Cube YouTube Channel – https://www.youtube.com/channel/UCFp1vaKzpfvoGai0vE5VJ0w. It is the ultimate source of Power BI knowledge.
I have posted a Power BI file that should look exactly like the one you just built if you followed my instructions! You can follow me on Twitter @STATCowboy, connect up with me on LinkedIn at https://www.linkedin.com/in/jameyj/.
Finally, please be safe during this global pandemic. Wash your hands. Keep safe social distance and limit your interactions with groups until the curve is flat! (You can see in the report you just built that it isn’t flat for the rest of the world!
Guidance from CDC – https://www.cdc.gov/coronavirus/2019-ncov/index.html
Code
GitHub Repo for Power BI Coronavirus Report Tutorial – https://github.com/STATCowboy/Power-BI-Coronavirus-Report-Tutorial