

Row Level Security in Power BI using Parent/Child Hierarchies
Jamey Johnston (@STATCowboy)
Overview
I wrote a blog post on using Parent/Child Hierarchies to enforce Row Level Security (RLS) in SQL Server 2016+. The demo in that article used a parent/child hierarchy for an organization combined with a flattened asset hierarchy to enforce strict row level security on a fictional Oil & Gas dataset for a fictional Oil & Gas organization. I recommend reading the “Overview of the Demo” and the “Asset and Organization Hierarchies and RLS” sections in that blog post before proceeding with this blog post. It will give you a good understanding of what hierarchies entail and how they are used in this demo/blog post.
We will only focus on the Organizational Hierarchy and how they can be used to enforce RLS in Power BI in this blog post. Think about creating a HR report and have it automatically filter the person logged into the report and all direct reports under that person. Later we will bring in the Asset Hierarchy in a follow up blog post soon and combine the organizational and asset hierarchies to enforce a more complex RLS scheme as used in the MSSQL demo linked above.
GitHub
of the demo code and Power BI file.
Scripts and Explanation
There are 2 scripts to run to install the entire demo (and you just run them in the order they are number, 1 – 2). They are located in the oilgaspbidemo-SQL-Code folder in the GitHub. If you have used the ones for the RLS demo in SQL Server they are similar but create a different database (oilgaspbidemo) and use just a subset of the tables:
1 – Oil&Gas PBI Demo – BuildTables.sql
The script will create the database, oilgasrlsdemo2016, and the tables needed for the demo
The Tables are as such:
- ASSET_HIERARCHY – Table contains the asset hierarchy and is used to build the demo data for the asset hierarchy in the Well_Master table.
- DATES – Generic table to hold a date dimension for use later in an Excel Power Pivot model.
- SEC_ASSET_MAP – Table contains the entries mapping the organization units to the asset hierarchy levels for access to the data. The table would be managed by the security team for the application. Users and their subordinates are denied access to data via an entry of ou, ‘NONE’, ‘NONE’ or granted all access via an entry of ou, ‘ALL’, ‘ALL’.
- SEC_ORG_USER_BASE – Table contains the employees including the employee to manager parent/child relationship to build an organization hierarchy and the organizational unit id for mapping to asset hierarchy levels for security. This table would likely be fed from an HR system. Also, will demonstrate Always Encrypted in this table.
- SEC_USER_EXCEPTIONS – Table contains entries to allow for overrides of the organization hierarchy based model. Any employee entered here will use permission defined in this table instead of what is inherited from the organizational hierarchy.
- WELL_DAILY_PROD – Contains COMPLETELY made-up and randomly generated daily well production data for Oil, Gas and NGL. Primary key is WELL_ID and RLS is achieved by using the asset hierarchy in the WELL_MASTER table to filter the WELL_IDs. This is a Clustered ColumnStore Indexed table.
- WELL_MASTER – Contains COMPLETELY made-up and randomly generated master well data including the made up asset hierarchy. This is the main business table used for RLS for ALL well tables.
- WELL_REASON_CODE – Contains COMPLETELY made-up and randomly generated daily well downtime data for Oil, Gas and NGL. Primary key is WELL_ID and RLS is achieved by using the asset hierarchy in the WELL_MASTER table to filter the WELL_IDs.
2 – Oil&Gas PBI Demo – LoadTables.sql
This script is used to load or generate the demo data including user and security tables and hierarchy and well data. There are two parameters close to the top that can be used to specify the amount of data to load – @wellcount and @drillyearstart. @wellcount specifies the number of wells to generate and @drillyearstart specifies the first possible year to use for a well. The start date for a well will be randomly selected between @drillyearstart and the current year the script is run.
There is also a Power BI file in the GitHub, Oil and Gas Power BI RLS Demo.pbix, to see the setup of the roles, DAX, tables and demo the hierarchies.
RLS in Power BI
So how do we accomplish Row Level Security in Power BI using a parent/child organizational hierarchy? First, we need to know the basics of RLS in Power BI. Let’s start with capturing the username of the currently connected user.
USERNAME() and USERPRINCIPALNAME() in DAX
The two DAX functions, USERNAME() and USERPRINCIPALNAME(), are the key to RLS based security and organizational hierarchies. It is the way we determine who is logged into the PowerBI.com Service and thus use that information (login name) to apply row level security. USERNAME() function returns the domain name and username for the currently connected user as DOMAIN\username where as the USERPRINCIPALNAME() function returns as username@domain.com.
Good article from Adam Saxton, Guy in a Cube GH|B|T|YT, on USERNAME() and RLS – https://powerbi.microsoft.com/en-us/blog/using-username-in-dax-with-row-level-security/. Might be worth a read before continuing with this article
RLS Roles
Next, we need to understand Roles in Power BI with RLS. Take a look at this article from Adam Saxton – https://docs.microsoft.com/en-us/power-bi/service-admin-rls – and then head back to this article …
Now that we understand RLS basics in Power BI let see how to implement RLS in Power BI using a Parent/Child relationship in an organization hierarchy.
Organizational Hierarchy
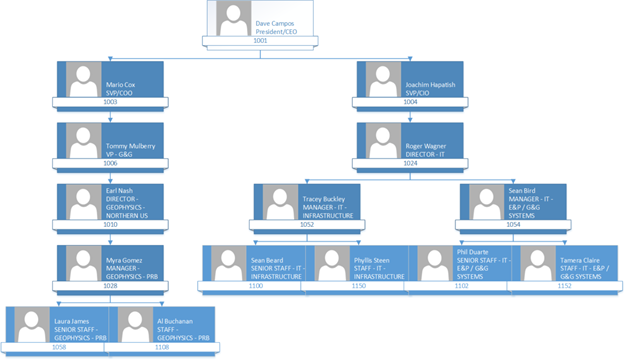
So, look at the following Organizational Hierarchy in the demo code described above. Let’s look at Joachim Hapitash in the organizational hierarchy. Under him are Roger Wagner and under Roger are Tracey and Sean. Now let’s say when Roger Wagner logs into the PowerBI HR Report we want to use the hierarchy to only show Roger his record and his employees under him in the hierarchy. How do you accomplish this? Keep reading and I will show you!

Parent/Child Hierarchy in SQL Server
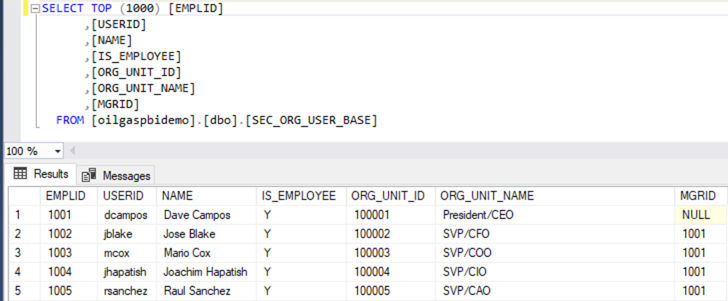
Now let’s examine the data for the SEC_ORG_USER_BASE table created in the demo. The table uses a unary relationship to relate the employee to his/her manager in the table. Look below and you will see that the CEO, Dave Campos, has NULL for MGRID. That is because he has no manager. But if you look at Joachim Hapitash you will see that he has 1001 for MGRID as Dave Campos, EMPLID = 1001, is his manager.
Now let’s use a recursive CTE to see how to relate the employee and managers together. If you run the following query against the SEC_ORG_USER_BASE table, you will get Roger and all the employees under Roger in the hierarchy.
oilgaspbidemo-SQL-Code\userhierarchyquery.sql
WITH DirectReports
(MGRID, EMPLID, NAME, MGR, ORG_UNIT_ID, ORG_UNIT_NAME, Level, ORG_LINEAGE, ORG_NAME_LINEAGE, NAME_LINEAGE)
AS
(
SELECT e.MGRID, e.EMPLID, e.NAME, cast(null as varchar(50)) as MGR,
e.ORG_UNIT_ID, e.ORG_UNIT_NAME,
0 AS Level,
cast(e.ORG_UNIT_ID as varchar(max)) as ORG_LINEAGE,
cast(e.ORG_UNIT_NAME as varchar(max)) as ORG_NAME_LINEAGE,
cast(e.NAME as varchar(max)) as NAME_LINEAGE
FROM dbo.SEC_ORG_USER_BASE AS e
WHERE MGRID IS NULL
UNION ALL
SELECT e.MGRID, e.EMPLID, e.NAME, d.NAME, e.ORG_UNIT_ID, e.ORG_UNIT_NAME,
Level + 1,
case when e.org_unit_id <> d.org_unit_id then cast(d.ORG_LINEAGE + ‘|’ +
cast(e.ORG_UNIT_ID as varchar(max)) as varchar(max)) else cast(d.ORG_LINEAGE as varchar(max)) end,
case when e.ORG_UNIT_NAME <> d.ORG_UNIT_NAME then cast(d.ORG_NAME_LINEAGE + ‘|’ +
e.ORG_UNIT_NAME as varchar(max)) else cast(d.ORG_NAME_LINEAGE as varchar(max)) end,
case when e.NAME <> d.NAME then cast(d.NAME + ‘|’ + e.NAME as varchar(max)) else cast(d.NAME as varchar(max)) end
FROM dbo.SEC_ORG_USER_BASE AS e
INNER JOIN DirectReports AS d
ON e.MGRID = d.EMPLID
)
SELECT MGRID, EMPLID, NAME, MGR, ORG_UNIT_ID, ORG_UNIT_NAME, Level, ORG_LINEAGE, ORG_NAME_LINEAGE, NAME_LINEAGE
FROM DirectReports
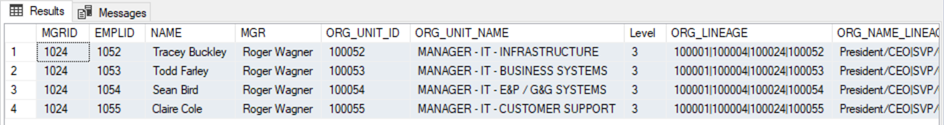
WHERE NAME_LINEAGE like ‘Roger Wagner%’;
GO
The results are as such:
Power BI, RLS and Organizational Hierarchies
Next, we add the SEC_ORG_USER_BASE table into Power BI and add some calculated columns (Path, Level 1, Level 2, Level 3, Level 4, Level 5, Level 6, and HierarchyLevel) and one measure (MaxNumLevels). In this demo we will only look at the SEC_ORG_USER_BASE table. In the next blog article, we will look at all the tables in the demo!
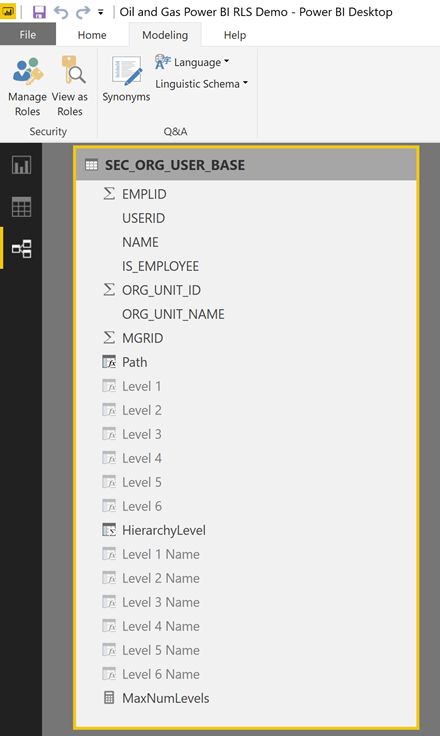
Below is the DAX for the calculated columns and measure:
- Path = PATH(SEC_ORG_USER_BASE[EMPLID],SEC_ORG_USER_BASE[MGRID])
- Level 1 = PATHITEM(SEC_ORG_USER_BASE[Path],1)
- Level 2 = PATHITEM(SEC_ORG_USER_BASE[Path],2)
- Level 3 = PATHITEM(SEC_ORG_USER_BASE[Path],3)
- Level 4 = PATHITEM(SEC_ORG_USER_BASE[Path],4)
- Level 5 = PATHITEM(SEC_ORG_USER_BASE[Path],5)
- Level 6 = PATHITEM(SEC_ORG_USER_BASE[Path],6)
- Level 1 Name = LOOKUPVALUE(SEC_ORG_USER_BASE[NAME], SEC_ORG_USER_BASE[EMPLID], VALUE(PATHITEM(SEC_ORG_USER_BASE[Path],1)))
- Level 2 Name = LOOKUPVALUE(SEC_ORG_USER_BASE[NAME], SEC_ORG_USER_BASE[EMPLID], VALUE(PATHITEM(SEC_ORG_USER_BASE[Path],2)))
- Level 3 Name = LOOKUPVALUE(SEC_ORG_USER_BASE[NAME], SEC_ORG_USER_BASE[EMPLID], VALUE(PATHITEM(SEC_ORG_USER_BASE[Path],3)))
- Level 4 Name = LOOKUPVALUE(SEC_ORG_USER_BASE[NAME], SEC_ORG_USER_BASE[EMPLID], VALUE(PATHITEM(SEC_ORG_USER_BASE[Path],4)))
- Level 5 Name = LOOKUPVALUE(SEC_ORG_USER_BASE[NAME], SEC_ORG_USER_BASE[EMPLID], VALUE(PATHITEM(SEC_ORG_USER_BASE[Path],5)))
- Level 6 Name = LOOKUPVALUE(SEC_ORG_USER_BASE[NAME], SEC_ORG_USER_BASE[EMPLID], VALUE(PATHITEM(SEC_ORG_USER_BASE[Path],6)))
- HierarchyLevel = PATHLENGTH(PATH(SEC_ORG_USER_BASE[EMPLID], SEC_ORG_USER_BASE[MGRID]))
- MaxNumLevels = MAX(SEC_ORG_USER_BASE[HierarchyLevel])
The Path column give a pipe, “|” separated list of the hierarchy at that node.
The Level X columns give the EMPLID of the LEVEL X employee at that level in the hierarchy. You will use these columns to build a hierarchy for the report.
The Level X Name columns give the NAME of the LEVEL X employee at that level in the hierarchy. You will use these columns to build a hierarchy for the report.
The HierarchyLevel column gives the depth of the organizational level of the employee.
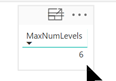
The MaxNumLevels measure calculates the max levels in the hierarchy. Used to determine the number of Level X columns to create. Don’t filter any employees and it will show “6” in this demo if you add a table with just the measure.
These DAX statements use the Parent and Child DAX functions described here – https://msdn.microsoft.com/en-us/library/mt150102.aspx.
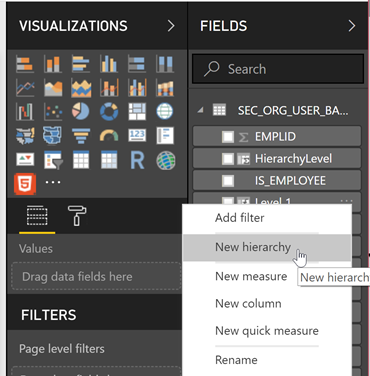
Now let’s setup a hierarchy in the Power BI model so we navigate the organizational hierarchy in visuals. This is accomplished by right-clicking on “Level 1″in the Fields section on the far right and choosing “New hierarchy”.
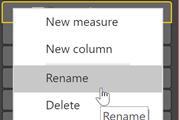
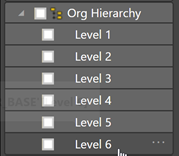
This will create a new hierarchy called “Level 1 Hierarchy”. Let’s rename it to “Org Hierarchy” by right-clicking (or clicking the ellipses – three dots – to the right of the name) and choosing “Rename”.
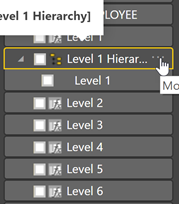
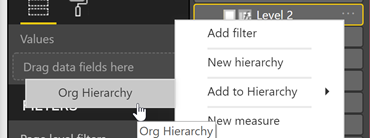
To add the remaining levels to the Hierarchy, starting with Level 2 and ending with Level 6 right-click and select “Add to Hierarchy -> Org Hierarchy” for each level until they are all in the hierarchy.
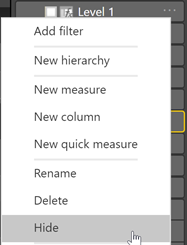
We can hide “Level X” columns now that we have a hierarchy defined. Right-click on each “Level X” field and choose “Hide”.
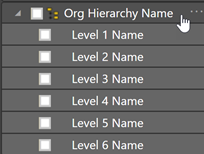
We will repeat the above for the “Level X Name” columns and call the hierarchy “Org Hierarchy Names”.
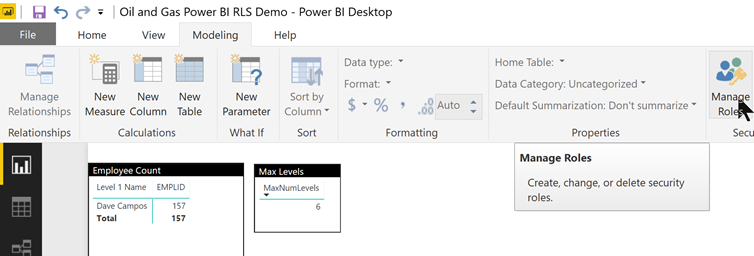
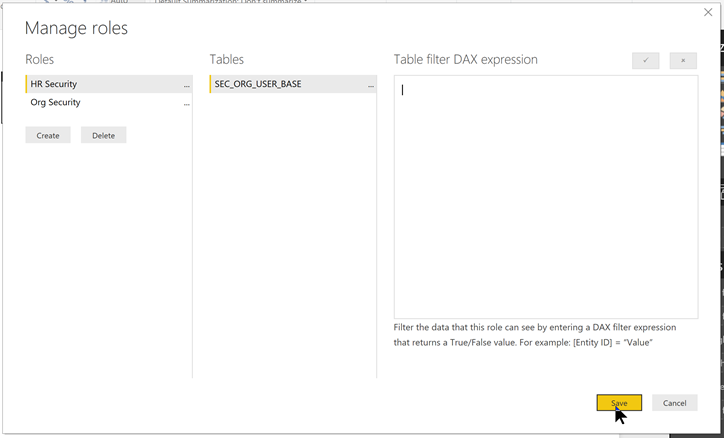
Now let’s setup the Row Level Security. To do this we will setup a role called “Org Security”. Under the “Modeling” menu choose “Manage Roles”.
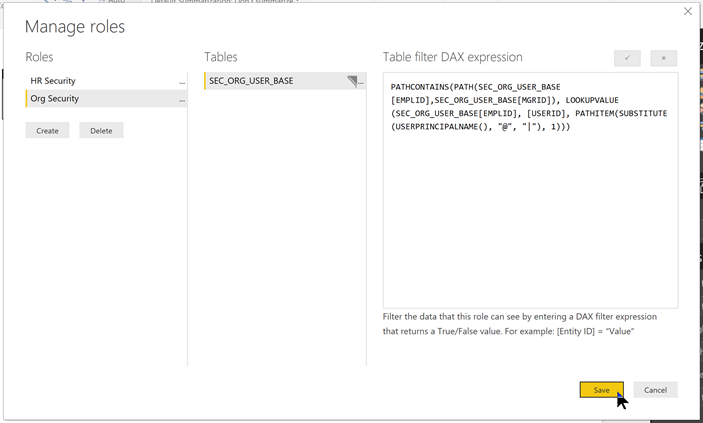
When the Manage roles dialog pops up create a new role called “Org Security” for the table “SEC_ORG_USER_BASE” and use the following DAX expression as the Table filter and “Save”.
PATHCONTAINS(PATH(SEC_ORG_USER_BASE[EMPLID],SEC_ORG_USER_BASE[MGRID]),
LOOKUPVALUE(SEC_ORG_USER_BASE[EMPLID], [USERID],
PATHITEM(SUBSTITUTE(USERPRINCIPALNAME(), “@”, “|”), 1)))
The DAX expression is doing the following:
- Uses the PATHCONTAINS DAX function to search the Parent/Child hierarchy (by using the PATH DAX function) to find the employee record and all employee records under that employee.
- Uses the LOOKUPVALUE DAX function to convert the logged in USERID to the EMPLID.
- Uses the PATHITEM(SUBSTITUTE(USERPRINCIPALNAME(), “@”, “|”), 1)) DAX expression to convert the USERPRINCIPALNAME() (e.g. mcox@poweroilandgas.com) to the USERID (e.g. mcox) and feed the LOOKUPVALUE DAX function to get the EMPLID to feed the PATHCONTAINS DAX function.
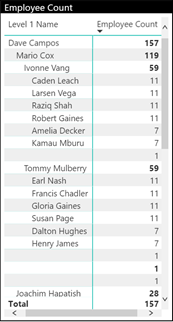
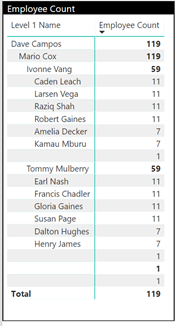
Now let’s test the security! There is a “Matrix” visual added to the PBIX file in the downloads. It has the “Org Hierarchy Names” added to it as well as a column with counts by “EMPLID”. This will show us the employee counts at each level of the hierarchy in the organization.
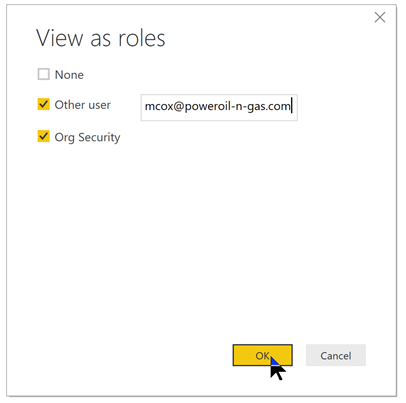
Now let’s use the “View as Roles” to test! Click the “View as Roles” button under the Modeling menu.
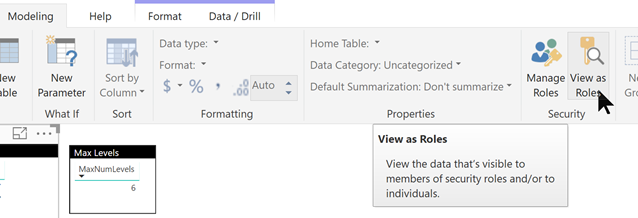
Then enter mcox@poweroil-n-gas.com for “Other user” and check the “Other user” box. Also, check the “Org Security” box to enable the “Org Security” role.
Now check the Matrix visual! It should be filtered to only “mcox” and employees under “mcox”. Notice how we only see 119 employees in the dataset now and NOT 157!
Now we need to add a HR Role to allow HR personnel the ability to see all employees and not limited to just their organizational units. This is easy to do. Just add a role called “HR Security” and leave the filter blank.
Now when you publish to the PowerBI.com service you would assign the HR personnel to the “HR Security Role” and all other personnel to the “Org Security” role.
Take a look again at the article from Adam Saxton – https://docs.microsoft.com/en-us/power-bi/service-admin-rls#manage-security-on-your-model – to see how to assign the users/groups to the Roles in the Power BI service and to test it in the Power BI service.